
People use my self-hosted services every day. My own infrastructure therefore includes monitoring that evolves with them: Zabbix 7.0 LTS, automated agent deployment, adapted templates and Matrix alerts with an SMS fallback.
In this article
This article describes my approach with a simplified example architecture. The interface illustrations use sample data. I model site failures virtually; several VMs in one physical location do not replace physically separate sites.
A new host should follow an established process
Ansible handles agent installation, configuration and onboarding. During deployment the agent requests a certificate from FreeIPA. Each agent receives an individual identity for its TLS connections.
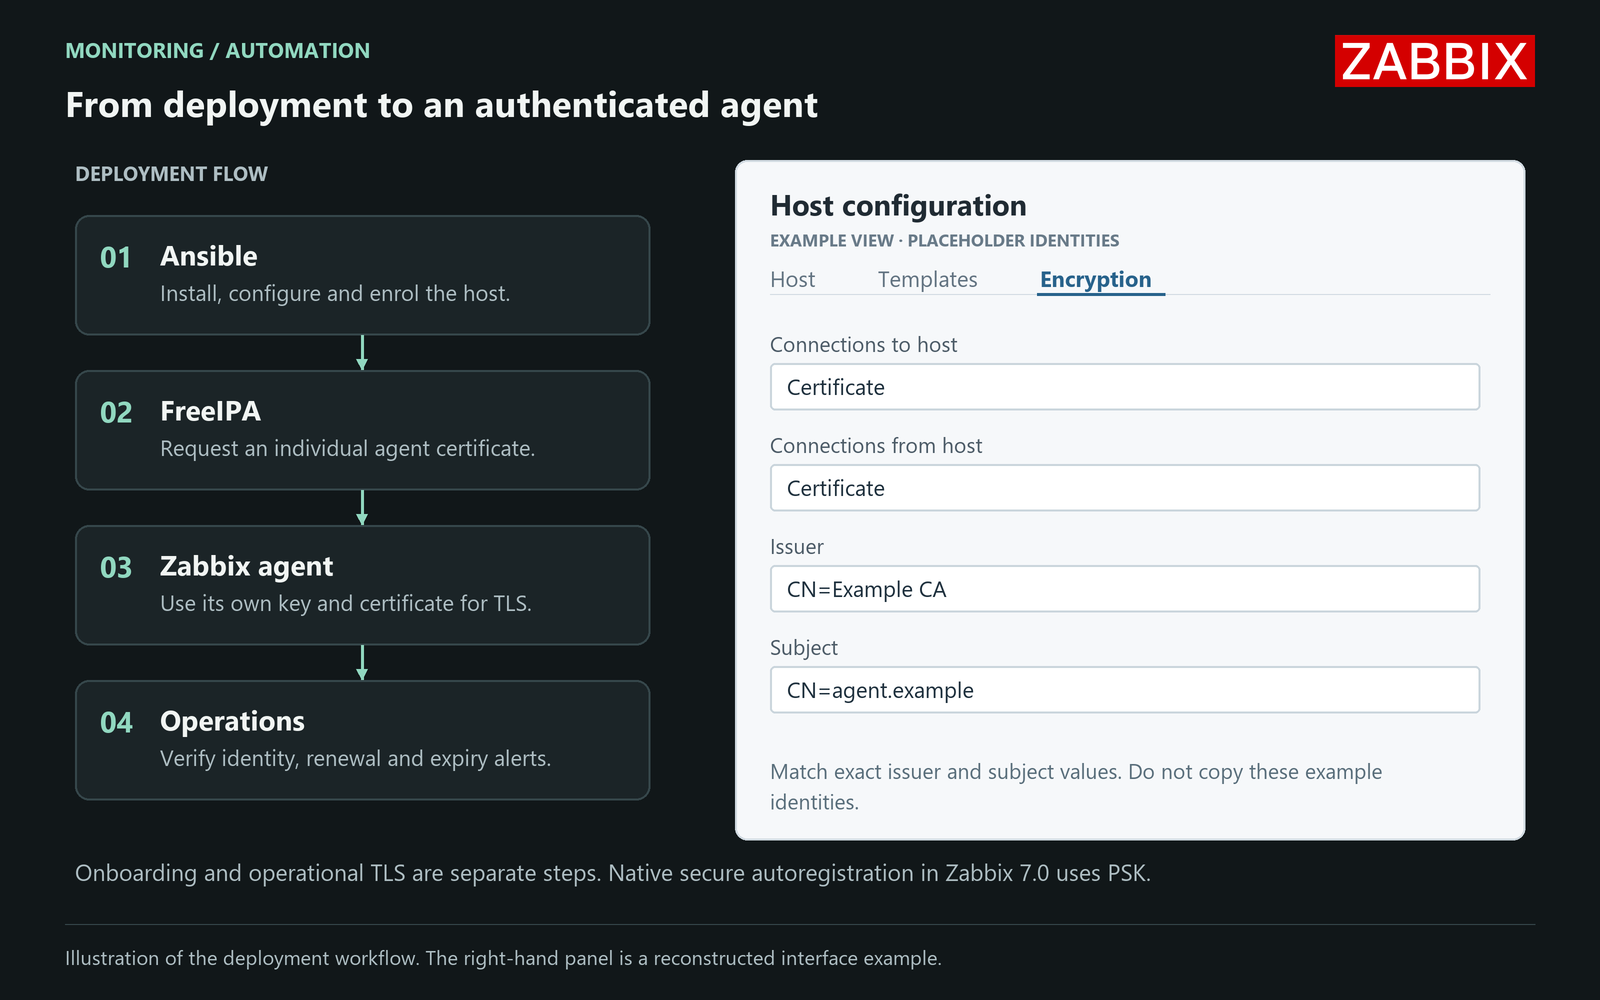
Onboarding and operational authentication are distinct. Native secure autoregistration in Zabbix 7.0 uses PSK; certificate-based agent communication is a separate configuration task. The automation has to cover both explicitly.
In operation, I care about the trusted CA and the expected peer. Zabbix supports issuer and subject restrictions. Accepting anything signed by a widely used internal CA would be too broad. Private-key permissions, renewal and expiry monitoring also belong in the process.
Zero Trust applies to monitoring too
My internal network receives no implicit trust. I treat internal access with the same care as public access: explicitly permit connections, verify peers and limit permissions to what is needed. In monitoring, that means individual agent certificates, restricted service accounts and clearly defined communication paths.
Adapt templates to the service
Web servers, databases and application checks account for much of my monitoring. Existing templates are a good starting point. I adapt intervals, thresholds and triggers, adding custom checks when an important question remains unanswered.
An HTTP check might evaluate status, latency and expected content. A database check might examine connections or the duration of a bounded query. Disk health, temperatures and interfaces can provide hardware context. These are design examples rather than an export of my configuration.
A custom check needs a defined success result and a timeout. Missing data must remain visible. Monitoring accounts need only the necessary read permissions. SNMPv3 needs authPriv for authenticated, encrypted polling; HTTPS and API checks must validate certificates. Network rules further restrict the communicating systems.
Start with impact, then investigate
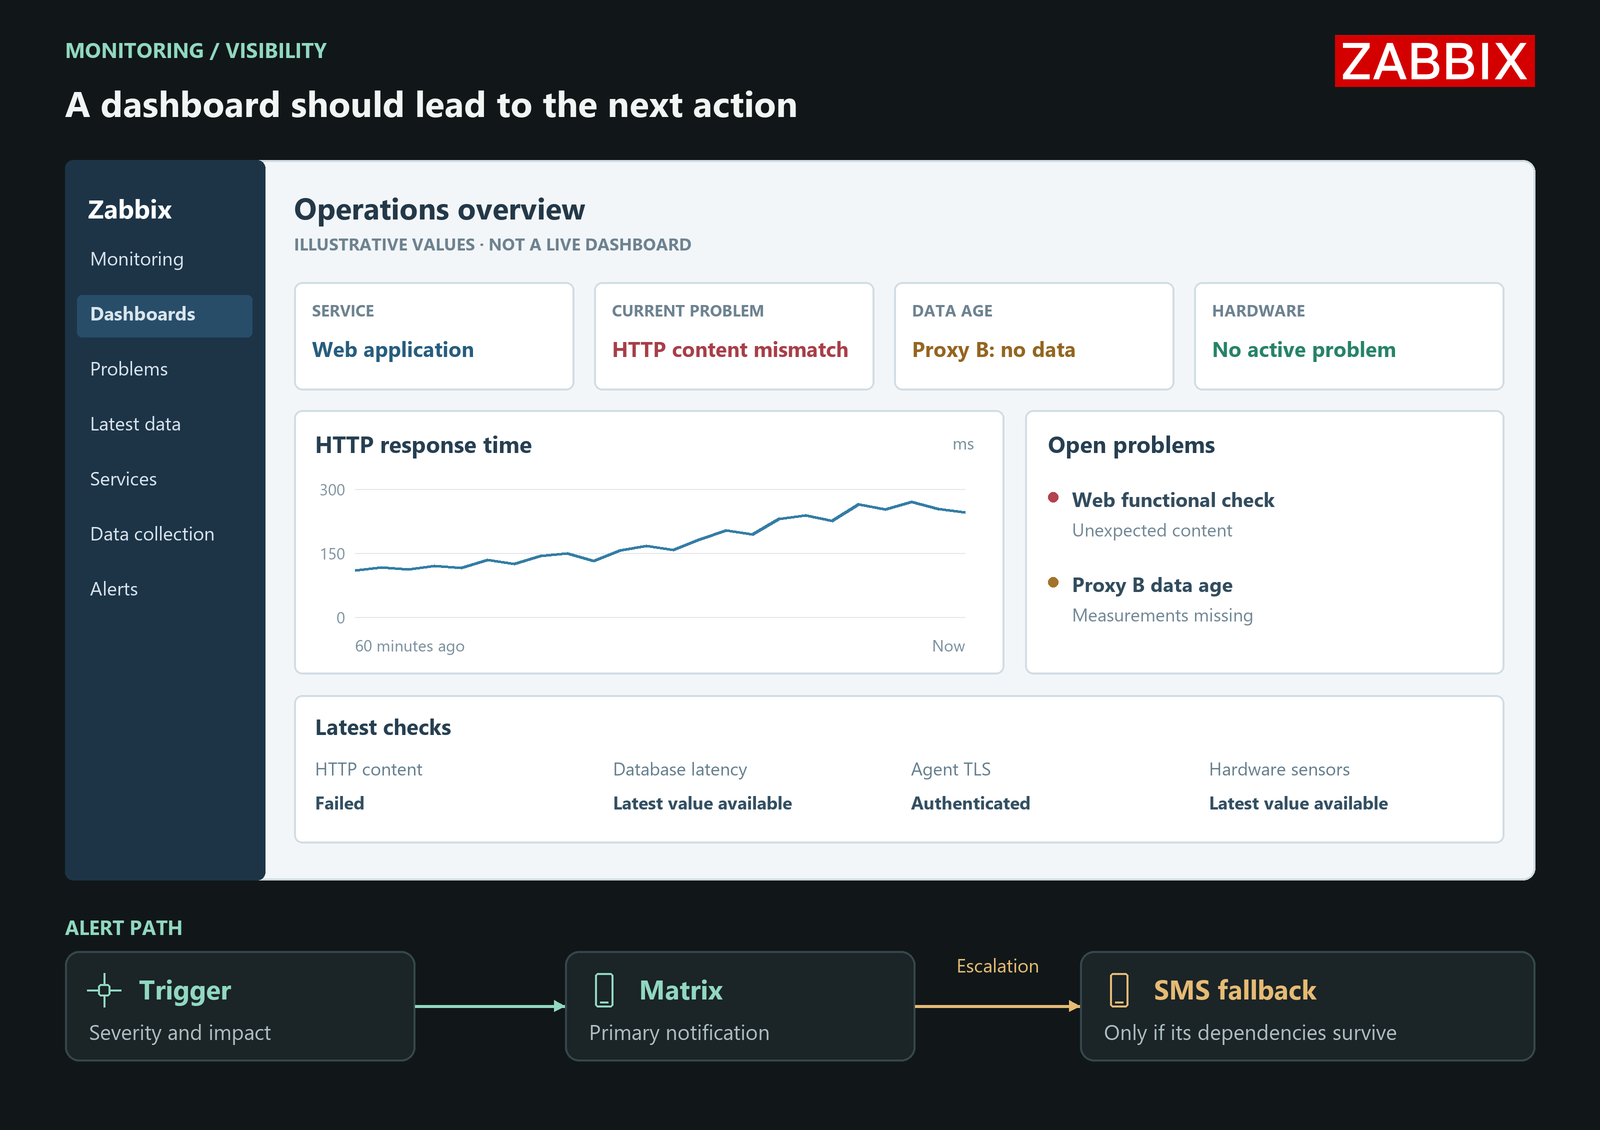
My first dashboard question is which service is affected. I would combine open problems, the age of the last value and a few useful graphs. In the example, a stale measurement remains “No data” rather than becoming an all-clear.
Host and service views hold the detail: HTTP errors, database connections, resources and sensors. SIEM monitoring and centralized log analysis add security context and investigation support. They serve a different purpose from availability and performance monitoring.
Housekeeping is part of operating the system
I plan collection intervals and retention together. History supports detailed recent investigation; trends support longer-term analysis of numeric values. Events and audit data have their own purposes and retention needs.
The practical questions are database growth, storage use and whether cleanup keeps pace. A uniform retention setting for every item can create unnecessary load. How old data is removed also depends on the database and partitioning approach.
Two servers do not complete the HA design
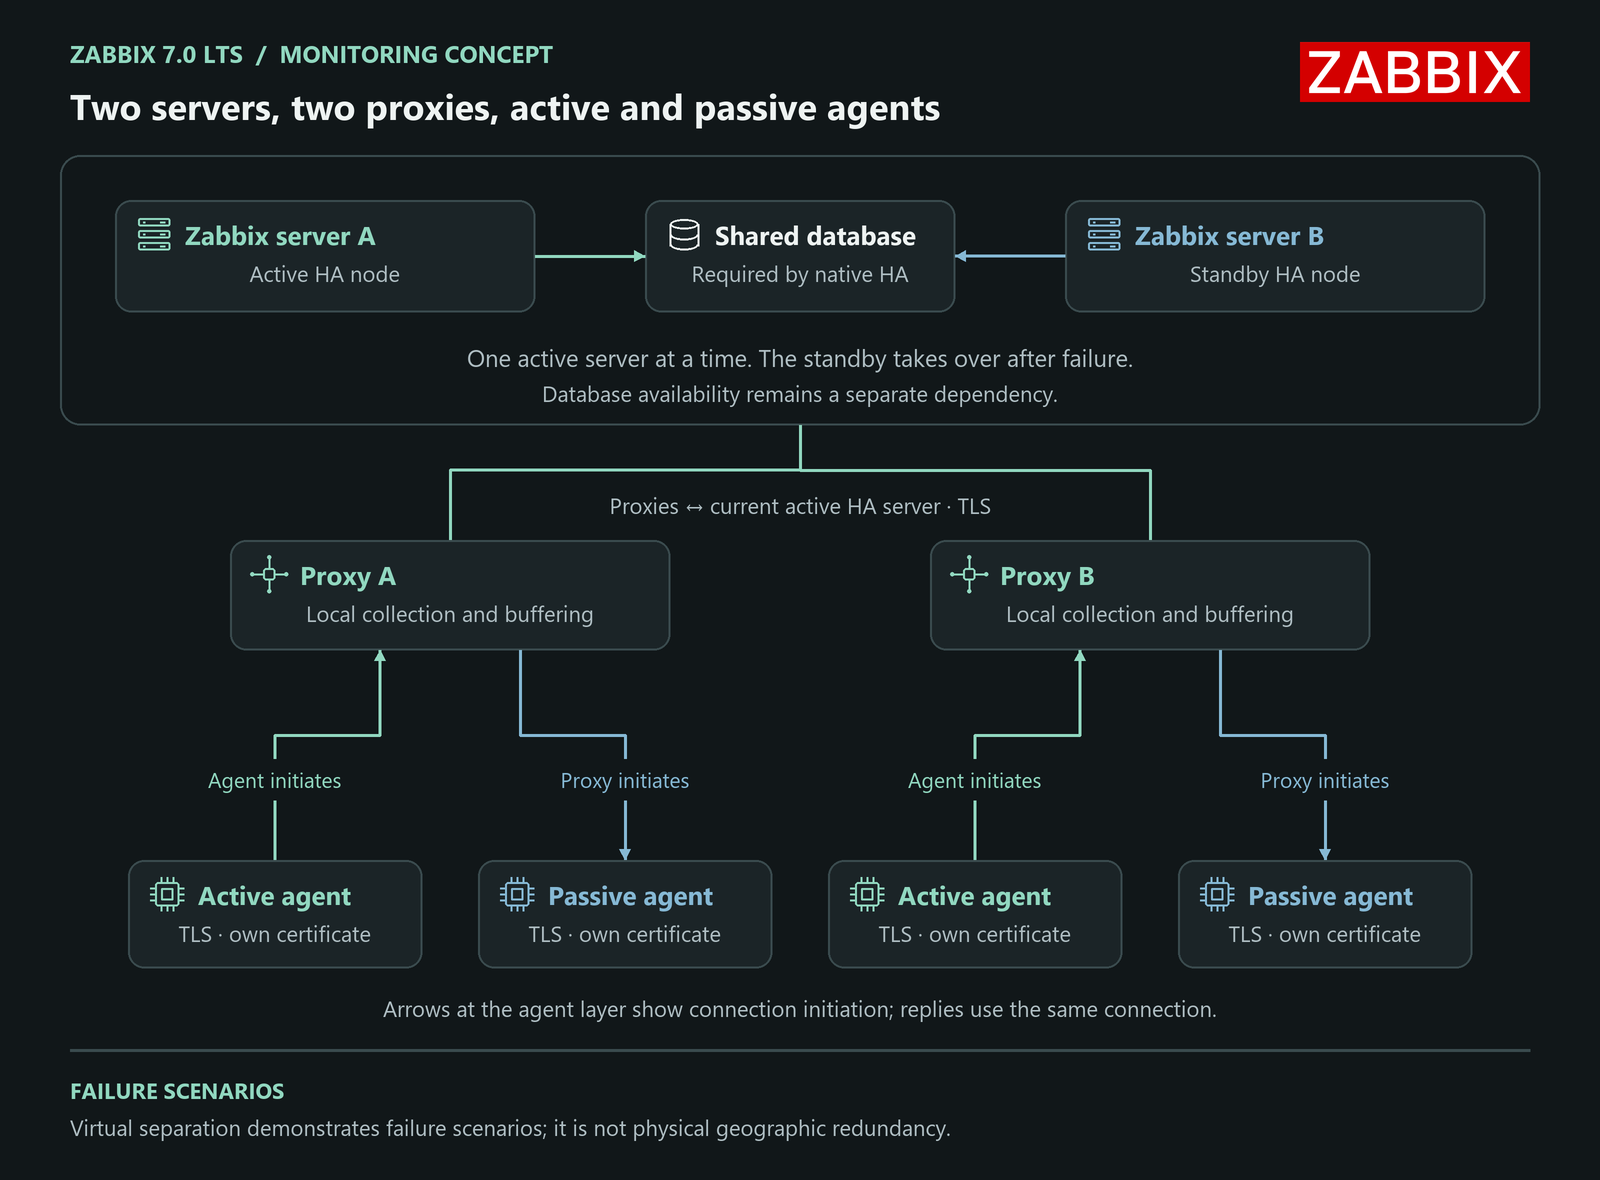
The diagram uses native server HA: one active node and one standby, both dependent on a shared database. Database availability remains a separate problem. Proxies collect near the hosts and can buffer already collected values while their connection to the server is interrupted.
An active agent initiates its connection; for passive checks, the proxy queries the agent. Proxy HA is configured separately. Two installed proxies alone are insufficient: proxy groups, host assignment, agent configuration and compatible versions must agree.
Include the alert path in the failure test
My notifications use Matrix with an additional SMS fallback module. Fail2ban checks defined access-log patterns and also reports events by email. I want a useful description of impact and sensible escalation rather than several copies of the same alert.
| Controlled fault | Expected evidence |
|---|---|
| Agent or connection stops | Missing measurements are visible; an old successful value is not current health. |
| Active Zabbix server stops | Standby takeover, resumed data flow and delayed values are checked. |
| Proxy or database stops | Its own dependency is tested rather than inferred from server HA. |
| Matrix cannot be reached | Configured escalation reaches SMS; its dependencies are included in the test. |
SMS is only a dependable fallback if its required components survive the failure being considered. A shared host, internet link or power circuit can affect both channels. Virtual tests help expose these dependencies but do not prove physical site resilience.
Conclusion
That is what makes monitoring useful to me: a repeatable onboarding process, a clearly authenticated connection, an understandable check result and a notification that reaches someone able to act.
Technical references: Zabbix 7.0: certificate authentication · Autoregistration · Server HA · Proxy groups · Housekeeping · Zero Trust: NIST SP 800-207